Home › Chinese Australia › Suburbs
Communities
Chinese suburbs of Australia 澳大利亚华人社区 Àodàlìyà Huárén Shèqū
Twenty-nine suburbs across five cities, and what is actually spoken in them. “Chinese” is a different language in Hurstville than it is in Box Hill.
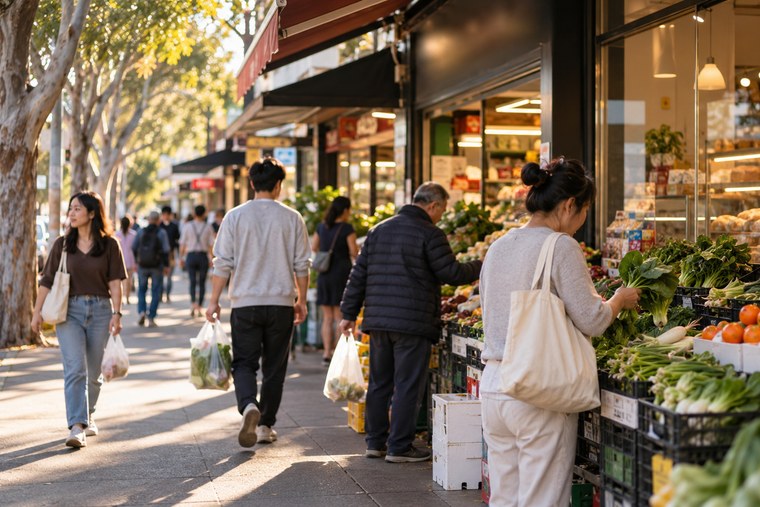
Ask which Australian suburb is the most Chinese and you will get an argument, because the answer changes depending on what you count. By ancestry it is Eastwood. By birthplace and by language it is Box Hill. Pick a metric and you pick a winner.
The more useful question is the one nobody asks: which Chinese, and when did they arrive? That one has a clean answer. You can read it straight off the Census, or off the shopfronts once you know what you are looking at.
The pattern
The Mandarin-to-Cantonese ratio is a migration history
Cantonese came first — Guangdong and Hong Kong, through the gold rushes and again after the war. Mandarin came later, from the mainland, mostly since the 1990s. A suburb’s ratio tells you which wave built it.
| Suburb | Mandarin | Cantonese | Ratio | English only |
|---|---|---|---|---|
| Clayton | 17.4% | 3.0% | 5.8 : 1 | 28.3% |
| Adelaide | 17.8% | 4.2% | 4.2 : 1 | 49.1% |
| Box Hill | 33.9% | 8.5% | 4.0 : 1 | 32.5% |
| Sunnybank | 26.7% | 6.8% | 3.9 : 1 | 38.2% |
| Robertson | 26.6% | 6.9% | 3.9 : 1 | 33.5% |
| Sunnybank Hills | 23.8% | 6.3% | 3.8 : 1 | 40.1% |
| Rochedale | 29.4% | 7.8% | 3.8 : 1 | 34.9% |
| Canning Vale | 10.3% | 2.7% | 3.8 : 1 | 52.9% |
| Rhodes | 30.2% | 8.3% | 3.6 : 1 | 21.0% |
| Mount Waverley | 16.6% | 4.7% | 3.5 : 1 | 47.0% |
| Macgregor | 24.8% | 7.2% | 3.4 : 1 | 38.3% |
| Wheelers Hill | 15.4% | 4.7% | 3.3 : 1 | 49.8% |
| Rossmoyne | 9.6% | 3.0% | 3.2 : 1 | 69.0% |
| Calamvale | 21.4% | 6.9% | 3.1 : 1 | 36.6% |
| Burwood | 32.1% | 10.8% | 3.0 : 1 | 19.8% |
| Willetton | 14.2% | 4.8% | 3.0 : 1 | 52.8% |
| Glen Waverley | 23.3% | 8.0% | 2.9 : 1 | 35.6% |
| Leeming | 6.3% | 2.3% | 2.7 : 1 | 77.4% |
| Runcorn | 16.0% | 6.1% | 2.6 : 1 | 40.2% |
| Campsie | 21.5% | 8.6% | 2.5 : 1 | 20.0% |
| Stretton | 24.5% | 9.9% | 2.5 : 1 | 34.6% |
| Mawson Lakes | 4.7% | 2.1% | 2.2 : 1 | 54.8% |
| Eastwood | 28.3% | 14.5% | 2.0 : 1 | 30.0% |
| Doncaster | 21.0% | 10.6% | 2.0 : 1 | 38.3% |
| Chatswood | 23.3% | 12.3% | 1.9 : 1 | 34.8% |
| Epping | 23.1% | 12.1% | 1.9 : 1 | 30.9% |
| Carlingford | 22.1% | 13.2% | 1.7 : 1 | 32.9% |
| Hurstville | 26.1% | 16.2% | 1.6 : 1 | 18.4% |
| East Killara | 21.8% | 15.9% | 1.4 : 1 | 43.3% |
Run the whole list and it stretches from Clayton at 5.8 to 1 down to East Killara at 1.4 to 1 — four times the gap, in the same country, on the same census night. Hurstville has been receiving Chinese families since long before the mainland wave, so its Cantonese layer sits thick underneath. Box Hill was largely built by that wave.
But the ratio on its own will mislead you, and three suburbs show exactly where.
Sunnybank runs 3.9 to 1, almost identical to Box Hill — yet 7.5% of it was born in Taiwan, the highest share here. Mandarin-speaking, certainly. A mainland story, not at all.
Willetton, Perth’s Chinese centre, sits mid-table at 3.0 to 1. The figure that matters is elsewhere on its record: more of Willetton was born in Malaysia (8.5%) than in China (7.1%), with another 2.9% from Singapore. Much of Chinese Perth arrived by way of Southeast Asia, where families often carry Mandarin, Cantonese and Hokkien at once. A single ratio cannot describe that.
Adelaide runs 4.2 to 1 and is not a suburb at all: a city centre with a median age of 31, built around the universities and Chinatown. Clayton, beside Monash, goes further still at 5.8 to 1 — the widest gap of all twenty-nine. Both are student quarters, and both ratios are measuring how recent a population is rather than how long it has been there.
So read the ratio with the birthplace beside it. Where they agree, as in Box Hill and Hurstville, the ratio is telling you the migration history. Where they disagree, the ratio is telling you something else, and the birthplace is the one to trust.
Suburb by suburb
Nine Chinese suburbs of Australia, and what sets each apart
Every figure below is from that suburb’s own 2021 Census record. The number that matters is rarely the headline one.
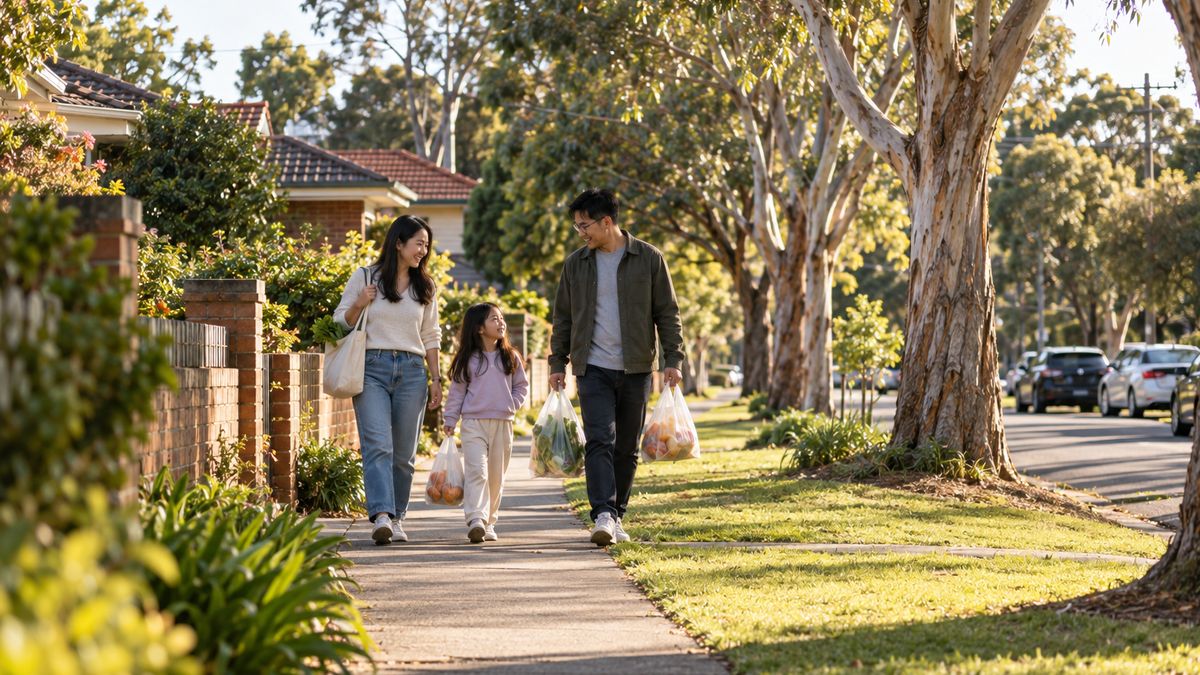
New South Wales
Hurstville
To hear what Sydney sounded like before the 1990s, come here.
- Chinese ancestry
- 47.1%
- Born in China
- 28.6%
- English only at home
- 18.4%
Among the nine profiled here, nowhere keeps a thicker Cantonese layer. And Hurstville is not only Chinese: 15.6% report Nepalese ancestry and 15.4% speak Nepali at home, which almost nothing written about the suburb bothers to mention.
New South Wales
Burwood
Burwood went vertical. The towers rose as the families arrived, and neither has stopped.
- Chinese ancestry
- 48.3%
- Born in China
- 28.8%
- English only at home
- 19.8%
Only 19.8% of households speak English only, the lowest of the nine. Burwood also carries the same Nepalese layer as Hurstville, at 7.9%.
New South Wales
Eastwood
The highest Chinese ancestry anywhere in this set, and it arrived in two waves.
- Chinese ancestry
- 48.8%
- Born in China
- 25.9%
- English only at home
- 30.0%
Eastwood is really two shopping strips: the Chinese side and the Korean side. 8.8% report Korean ancestry — the railway line is the seam.
New South Wales
Chatswood
A Cantonese city with a Mandarin city built on top of it.
- Chinese ancestry
- 42.4%
- Born in China
- 20.1%
- English only at home
- 34.8%
5.5% were born in Hong Kong, the highest share here. That is why the narrowest Mandarin-to-Cantonese gap outside Hurstville sits in the middle of the North Shore.
Victoria
Box Hill
No suburb in Australia has changed language faster.
- Chinese ancestry
- 46.6%
- Born in China
- 29.5%
- English only at home
- 32.5%
Mandarin (33.9%) has overtaken English-only (32.5%) as the language spoken at home. Four Mandarin speakers for every Cantonese speaker.
Victoria
Glen Waverley
The hardest one here to reduce to a single community.
- Chinese ancestry
- 38.0%
- Born in China
- 17.8%
- English only at home
- 35.6%
Chinese ancestry of 38.0% sits beside Indian 9.6%, with another 5.3% born in Sri Lanka. Three communities of real size, in one set of streets.
Queensland
Sunnybank
Mandarin-speaking, like Box Hill. Almost everything else about it is different.
- Chinese ancestry
- 35.0%
- Born in China
- 16.9%
- English only at home
- 38.2%
7.5% were born in Taiwan, far the highest share anywhere here and more than double the China-born share of some suburbs. Same language, quite different history.
Western Australia
Willetton
Most of Chinese Perth came the long way round, through Malaysia.
- Chinese ancestry
- 26.3%
- Born in China
- 7.1%
- English only at home
- 52.8%
More of Willetton was born in Malaysia (8.5%) than in China (7.1%), with another 2.9% from Singapore. This community arrived by way of Southeast Asia, and the ratio tells you far less about it than the same figure would in Sydney.
South Australia
Adelaide
Not a suburb at all. A student quarter that happens to be a city centre.
- Chinese ancestry
- 25.5%
- Born in China
- 15.7%
- English only at home
- 49.1%
4.2 to 1 on a median age of 31. This is a student quarter around the universities and Chinatown rather than a family suburb, and the ratio is measuring recency instead of history — the same thing Clayton does, further up the table.
All figures: Australian Bureau of Statistics, 2021 Census QuickStats, each taken from that suburb’s own SAL record. The nine written up above are SAL11971, SAL10716, SAL11372, SAL10891, SAL20314, SAL21013, SAL32694, SAL51612, SAL40002; the other twenty on the map were pulled the same way. Suburb-level geography throughout: Sunnybank also exists as a larger statistical area with different figures, which is not what is used here.
Where they are
The Chinese suburbs of Australia, mapped
Twenty-nine suburbs across five cities, every figure from that suburb’s own 2021 Census record. Pick a city and its suburbs appear, each dot sized by Chinese ancestry. Nine of them are written up in full below.
The map needs JavaScript. Every suburb and all of its figures are listed below.
Scroll-zoom stays off until you click the map, so the page keeps scrolling normally.
The mechanism
Why these suburbs, and not others
The ratio tells you which wave built a suburb. It does not tell you why that wave landed there. Two things decide that, and neither is an accident.
First, arrivals come in cohorts, and cohorts have dates. On 9 June 1989, days after Tiananmen, the Hawke government offered asylum to “some 42,000 Chinese nationals in Australia”, in the ABC’s wording. Most were students already here. They stayed, they were later joined by family, and they are the beginning of the mainland, Mandarin-speaking population that now shows up in Box Hill at 33.9%. Cantonese-speaking arrivals from Hong Kong and Guangdong had already been coming for decades before that, which is why the Cantonese layer in Hurstville sits underneath the Mandarin one rather than beside it.
Second, and more powerfully: people settle where people like them already are. A suburb with a Chinese grocer, a Chinese doctor and a Chinese-speaking agent is easier to arrive into than one without, and every family who arrives makes it easier for the next. So the clusters hold for generations instead of dispersing, and the map barely moves from one Census to the next.
You can see both forces in the numbers on this page. Adelaide’s city centre has a median age of 31 because its Chinese population is a student cohort that mostly arrived in the last fifteen years. Hurstville’s runs older and more Cantonese because its first families arrived long before. Willetton is the clearest case of all: its Chinese community came by way of Malaysia and Singapore, so it clusters in Perth’s southern suburbs rather than in the places Sydney’s mainland arrivals chose.
On the street
How to tell which Chinese a shopfront is speaking
You do not need to read fluently to read a street. Four things give it away.
Guangdong
mainland
HK · Taiwan
The province most early Chinese Australians came from. Same word, two systems.
Bread
mainland
HK · Taiwan
On a bakery awning, the first character is the whole tell.
Restaurant
mainland
HK · Taiwan
The second character changes; the first does not. Most signs differ in one glyph.
Prosperity
mainland
HK · Taiwan
From gong xi fa cai. On doors every Lunar New Year, in both systems.
Set in real type, not photographed — a generated image of signage produces characters that look right and are not, which is the one error readers of this page would catch.
1. Simplified or traditional characters. Mainland China uses simplified; Hong Kong, Taiwan and Macau use traditional. A sign reading 广东 is simplified; 廣東 is the same word in traditional. A strip of traditional signage in 2026 usually means the business was set up by a Cantonese- or Taiwanese-speaking family, whatever the suburb’s overall ratio says.
2. What the bakery calls itself. A Hong Kong-style bakery tends to sign itself 餅店; a mainland chain is more likely to use 面包 or a transliterated brand name.
3. Which greeting is on the door at New Year. 恭喜发财 read as gong xi fa cai in Mandarin is the same four characters a Cantonese speaker reads as gung hei fat choi. The characters do not tell you the language — but the romanisation printed underneath does.
4. The queue. Honestly, the fastest test. Stand outside a bakery in Chatswood and one in Box Hill for five minutes each and you will hear the difference before you can read it.
No textbook teaches this part, because it is not really language. It is reading a place. We cover the characters themselves in Mandarin vs Cantonese, and the broader story in the Chinese Australians guide.
In the shop
Five things worth saying in a Chinese grocer
Reading the signage is half of it. These are the phrases that actually get used across a counter, with the characters set in real type.
First, the unit on every price label: 斤 jīn
Produce in a Chinese grocer is very often priced per 斤 (jīn) rather than per kilo — so it is the one word worth knowing before you open your mouth. A jin is roughly half a kilo, but exactly how much depends on where the shop’s owners came from:
- Mainland China — the market jin, 市斤 (shìjīn), is exactly 500 g.
- Hong Kong — the catty is formalised at about 605 g.
- Taiwan — rounded to 600 g.
So the same character on two price labels in two suburbs can mean a fifth more or less of whatever you are buying. If you want a kilogram, ask for 一公斤 (yī gōngjīn) — literally a “public jin” — and there is no ambiguity.
It is the page’s whole argument printed on a price tag: which Chinese you are standing in front of changes the answer. The phrases below use the word, now that it means something.
The natural market phrasing. It asks the price and the unit at once, which matters more than you would think now that you know a jin is not a fixed weight.
Worth more than any other phrase here. Most grocers are pleased to be asked, and it is how you learn the name of something you have been walking past for years.
Lessons
Mandarin lessons in these cities
All one-to-one and online, so the suburb matters less than the timezone — but if you want a teacher who knows the difference between Hurstville and Box Hill, that is the point.
New South Wales
Hurstville · Burwood · Eastwood · Chatswood · East Killara · Rhodes · Carlingford · Epping · Campsie
Victoria
Box Hill · Glen Waverley · Doncaster · Mount Waverley · Wheelers Hill · Clayton
Queensland
Sunnybank · Sunnybank Hills · Rochedale · Stretton · Robertson · MacGregor · Calamvale · Runcorn
Questions
Questions about Chinese suburbs in Australia
Which Australian suburb has the largest Chinese community?
It depends entirely on what you measure, which is why we have not named one. By ancestry it is Eastwood in Sydney, at 48.8% — just ahead of Burwood (48.3%) and Hurstville (47.1%). By share born in China it is Box Hill in Melbourne at 29.5%. By Mandarin spoken at home it is Box Hill again, at 33.9%. And by the Mandarin-to-Cantonese ratio it is Clayton in Melbourne at 5.8 to 1, which is really a student suburb. Anyone who gives you a single answer has chosen the metric that produces it.
Should I learn Mandarin or Cantonese for my suburb?
Mandarin, in every one of the twenty-nine places mapped here, and by a wide margin in Clayton (5.8 to 1), Adelaide (4.2 to 1) and Box Hill (4.0 to 1). Cantonese is the better answer when your reason is a particular family rather than a particular postcode — and East Killara, at 1.4 to 1, is the closest thing on this page to a genuine toss-up. The Australian picture, state by state, is in Mandarin or Cantonese in Australia, and the worldwide comparison is in Mandarin vs Cantonese: which should you learn?
Why do Hurstville and Box Hill sound so different?
Because they were built by different waves. Cantonese-speaking families from Guangdong and Hong Kong arrived in Sydney’s south decades before the mainland migration of the 1990s, so Hurstville has a thick Cantonese layer underneath a Mandarin one — 26.1% to 16.2%. Box Hill’s Chinese population is largely recent and largely from the mainland, so it runs 33.9% to 8.5%. The ratio is the history.
Are these suburbs only Chinese?
No, and the figures are blunt about it. Hurstville is 15.6% Nepalese by ancestry and 15.4% Nepali-speaking at home. Eastwood is 8.8% Korean. Glen Waverley is 9.6% Indian with another 5.3% born in Sri Lanka. Sunnybank is 7.5% Taiwan-born, and in Willetton more people were born in Malaysia than in China. Calling any of them simply “a Chinese suburb” flattens a lot of people out of the picture.
Start learning
Learn the Mandarin your neighbours actually speak
One-to-one, on your timezone, with a teacher who grew up in both countries.
Book a free intro call